Table of contents
What is the best metric we should use to evaluate model performance in the classification problems when our dataset contains an imbalanced number of samples?
Classification Metrics
1. Precision
Definition
\[\text{Precision} = \frac{\text{TP}}{\text{TP} + \text{FP}}\]Precision is a metric that quantifies the number of samples predicted correctly to be belonging to the positive class out of all the samples that were predicted to be of the positive class.
- TP stands for True Positive, i.e., the number of samples that are correctly classified as positive class.
- FP stands for False Positive, i.e., the number of samples that are incorrectly classified as positive class.
2. Recall
Definition
\[\text{Recall} = \frac{\text{TP}}{\text{TP} + \text{FN}}\]Recall is a metric that quantifies the number of samples predicted correctly to be belonging to the positive class out of all the samples that actually belong to the positive class.
- TP stands for True Positive, i.e., the number of samples that are correctly classified as positive class.
- FN is False Negative, i.e., the number of samples that are incorrectly classified as negative class.
-
Recall is used when the model needs to capture all positive samples, i.e., the model needs to have a high recall value.
-
NOTE: Recall is also called
SensitivityorTrue Positive Rate.
3. F1 Score [1]
Definition
\[\text{Harmonic Mean} = \frac{\text{Number of values}}{\frac{1}{\text{Value 1}} + \frac{1}{\text{Value 2}} + ... + \frac{1}{\text{Value N}}}\]The F1 score is the harmonic mean/balance of a model’s precision and recall.
- Harmonic mean: is helpful when our results are skewed by outliers, because smaller values is given more weights.
- Here is the formula of F1 score deriving from Harmonic mean:
\[\text{F1 Score} = \frac{2}{\frac{1}{\text{Precision}} + \frac{1}{\text{Recall}}}, \text{where } 0 \leq \text{F1 Score} \leq 1\]F1 Scorevalue closing to 1 means that we have high Precision and high Recall => Good model.
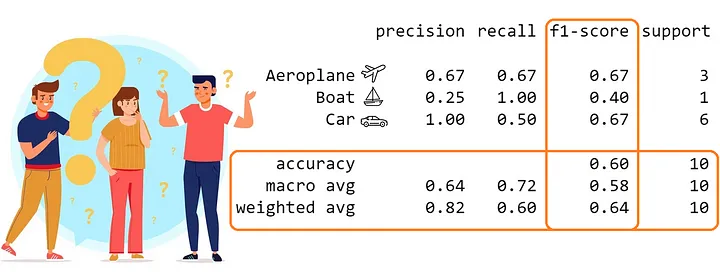
Variations of F1 Score
These variations are used to evaluate model’s performance over the entire dataset.
- Micro F1 Score: uses net TP, net FP, and net FN. It calculates scores over all classes. This metric gives equal importance to each sample.
-
NOTE:
-
net TP: means the sum of the class-wise TP.
-
For every confusion matrix, the net FP and net FN will have the same value.
-
-
Then, we will have the formulas for Micro Precision and Micro Recall as follows
- Micro Precision = Micro Recall = Micro F1-Score = Accuracy
- Macro F1 Score: calculates scores, i.e., Precision, Recall and F1, for each class, then get their unweighted mean to calculate the global score. This metric gives equal importance to each class.
-
NOTE:
- This method treats classes equally, thereby being useful for both imbalanaced/balanced datasets.
- Weighted F1 Score: still calculates scores for each class, but then it takes a sample-weighted mean of the class-wise scores.
-
NOTE:
- If we have an imbalanced dataset and we want to assign greater contribution to the class with more examples, weighted-F1 Score will be helpful [2].
4. Confusion Matrix [2-3]
Definition
Confusion matrix is a class-wise distribution of predictive performance in the supervised learning.
- It is highly recommended to read the post on [3] to understand which information confusion matrix brings in the multi-class classification problems.
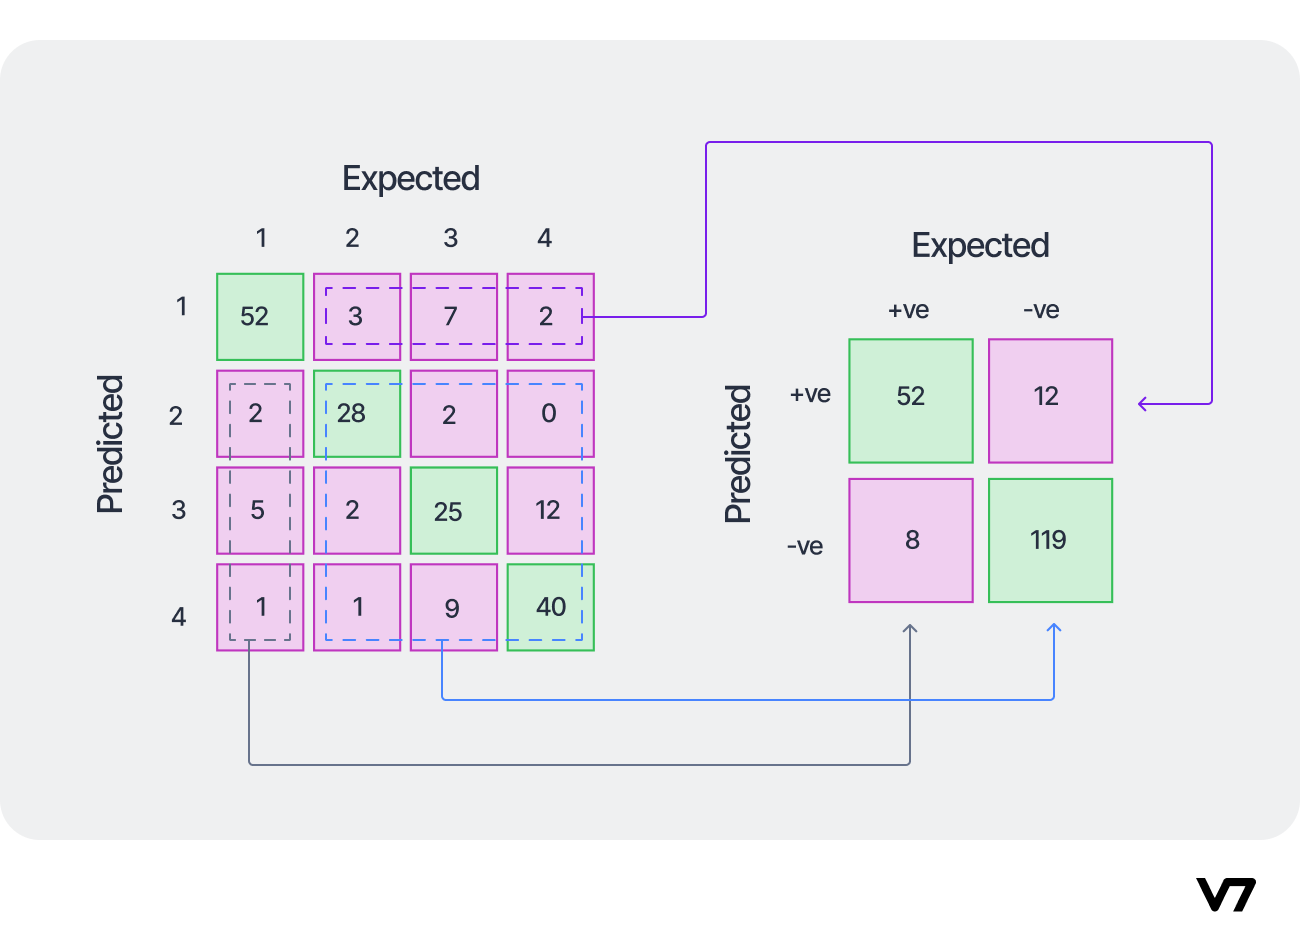
- For example, we will analysis the confusion matrix $M$ below

-
The diagonal elements will be correctly predicted samples, i.e., 2528 out of 2954 samples equivalent to $\text{Accuracy} = 85.58\%$.
-
$M_{BA} = 0$ means that our model does not confuse samples belonging to class A with class B => The classification boundary between class A and B was learned well.
-
The confusion matrix also shows that the model did not learn and classify well on the class C, i.e., misclassified on 130 + 136 = 266 samples.
-
We also can easily convert the matrix to one-vs-all matrix as shown below
Reference
2. Micro, Macro & Weighted Averages of F1 Score, Clearly Explained
3. Understanding Confusion Matrix
4. Confusion Matrix: How To Use It & Interpret Results [Examples]